“Above all, simplicity.”
GEOSPATIAL INDUSTRIAL INTERNET OF THINGS (IIOT) AGGREGATION HUB
Rosetta Stone for Geo-IoT feeds
High velocity real-time data into Enterprise GIS Systems
Visualize geospatial information as an aggregation or as discrete features
4D capabilities with time aware layers
Big data analytics ready, based on industry leading solutions
Built in monitoring of feed health
Esri REST Geoservices compliant (FeatureService)
Delivered as a service, cloud hosted.
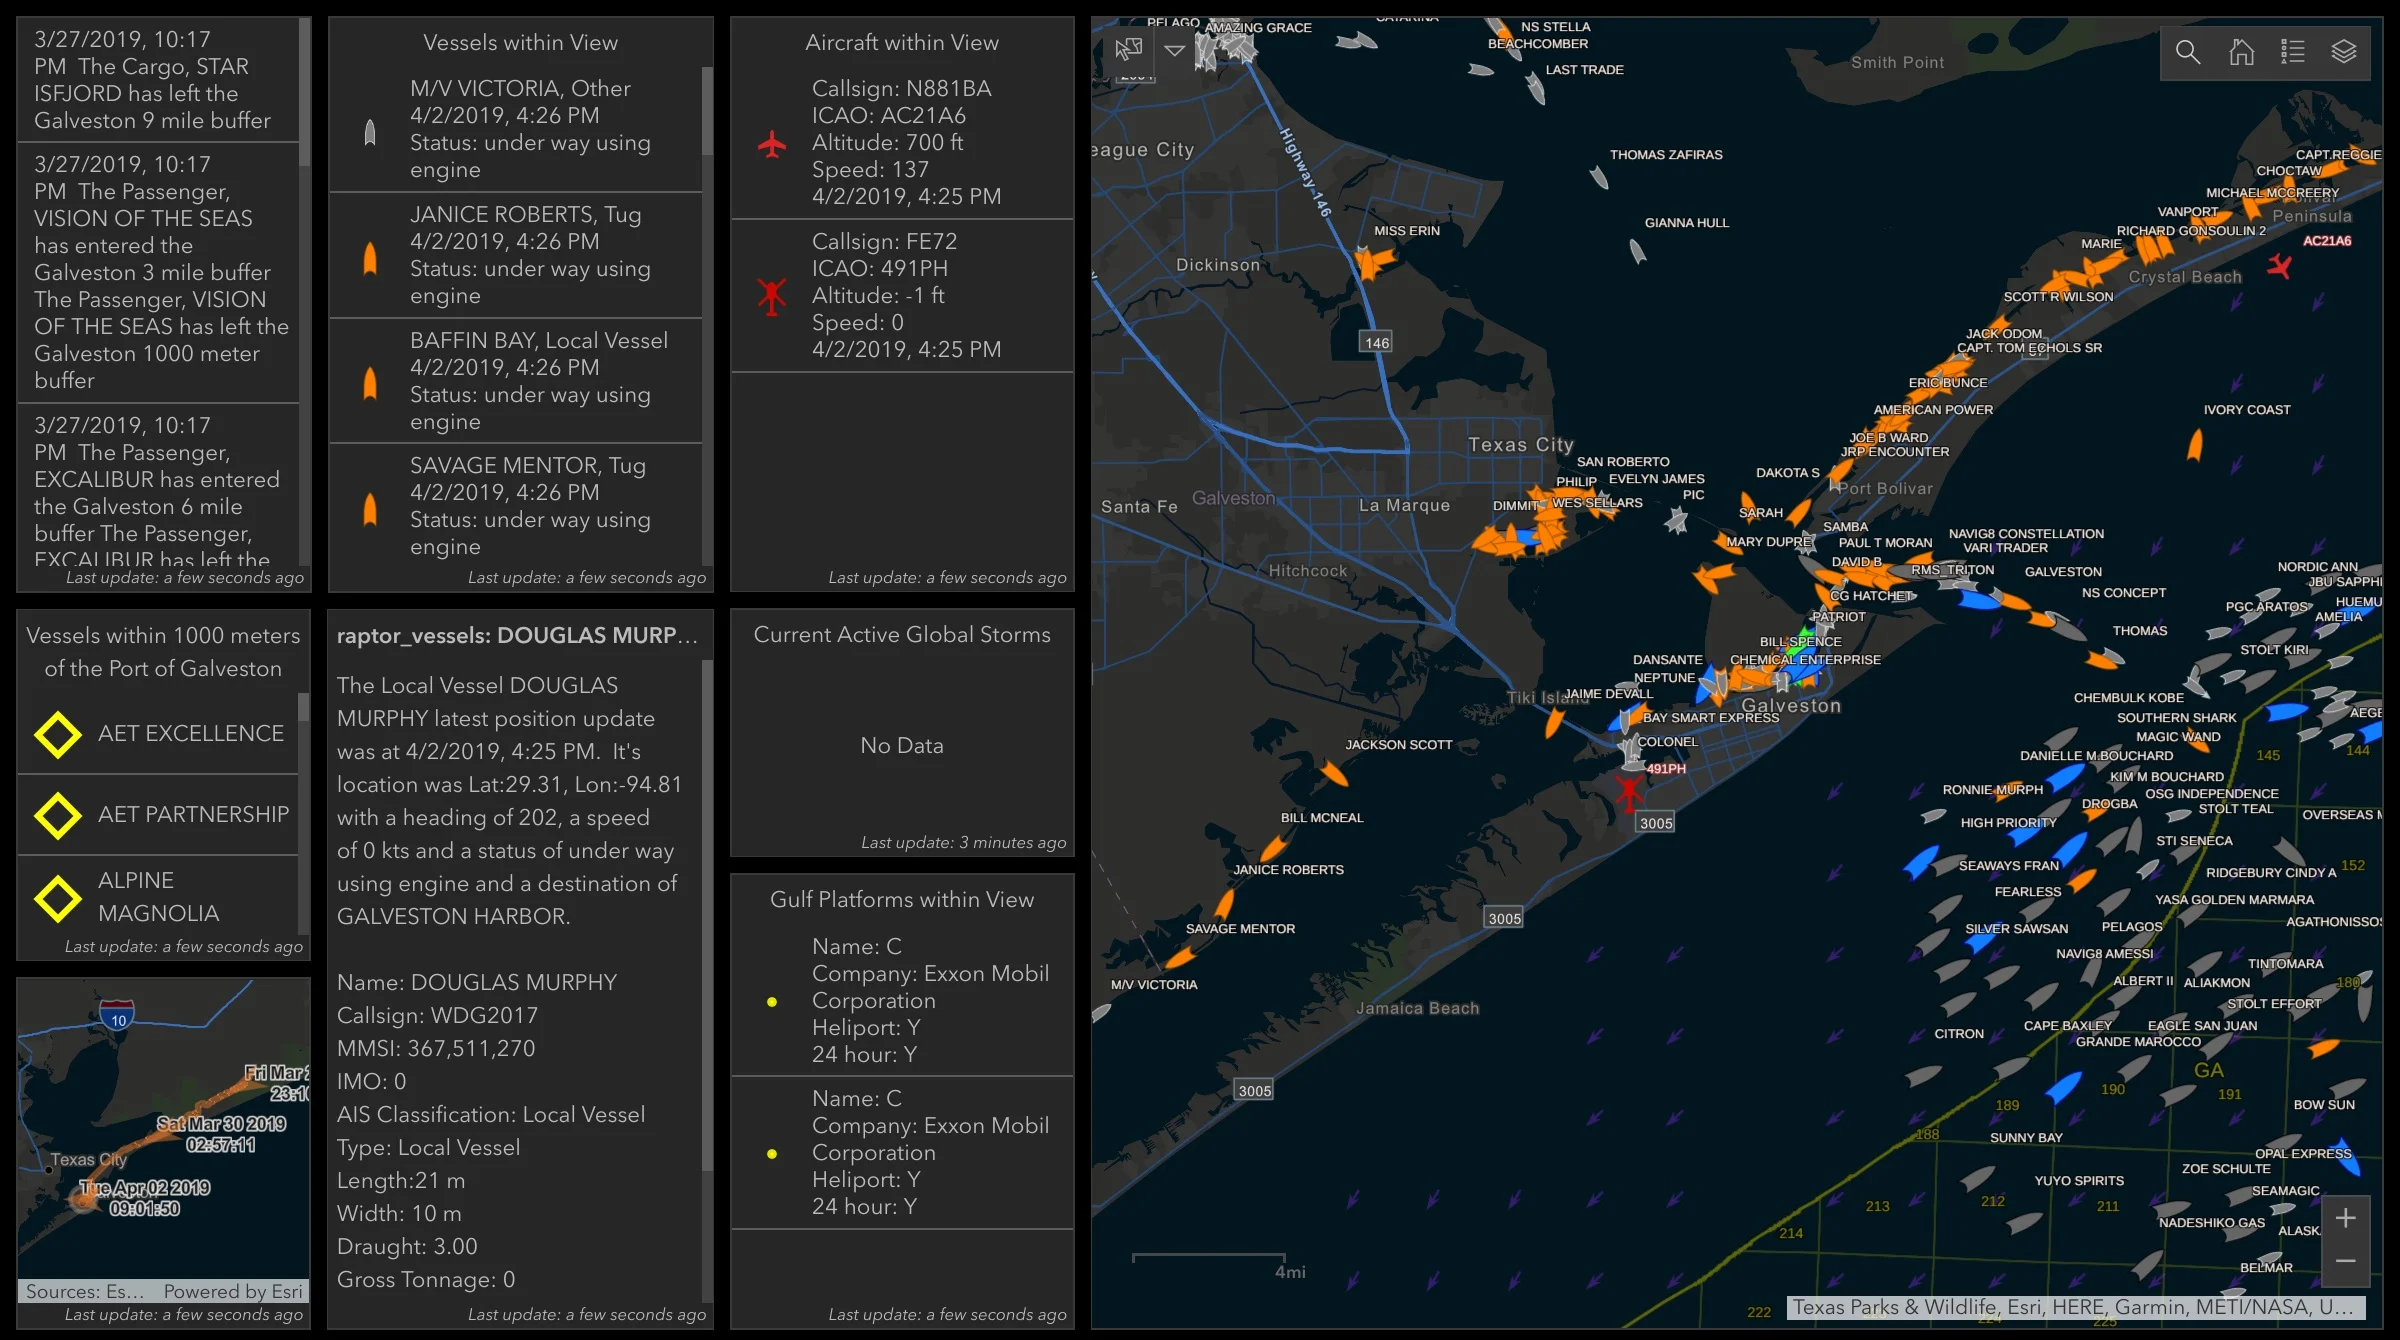
Raptor Geo-IoT services inside of esri’s Operations Dashboard in ArcGIS Online. This shows geofence and realtime vessel capabilties at the Port of Galveston The AIS vessel information is provided by Spire (spire.com)

Raptor Geo-IoT services inside of esri’s Operations Dashboard in ArcGIS Online. This shows geofence and realtime vessel capabilties at the Port of Aberdeen. The AIS vessel information is provided by Spire (spire.com)
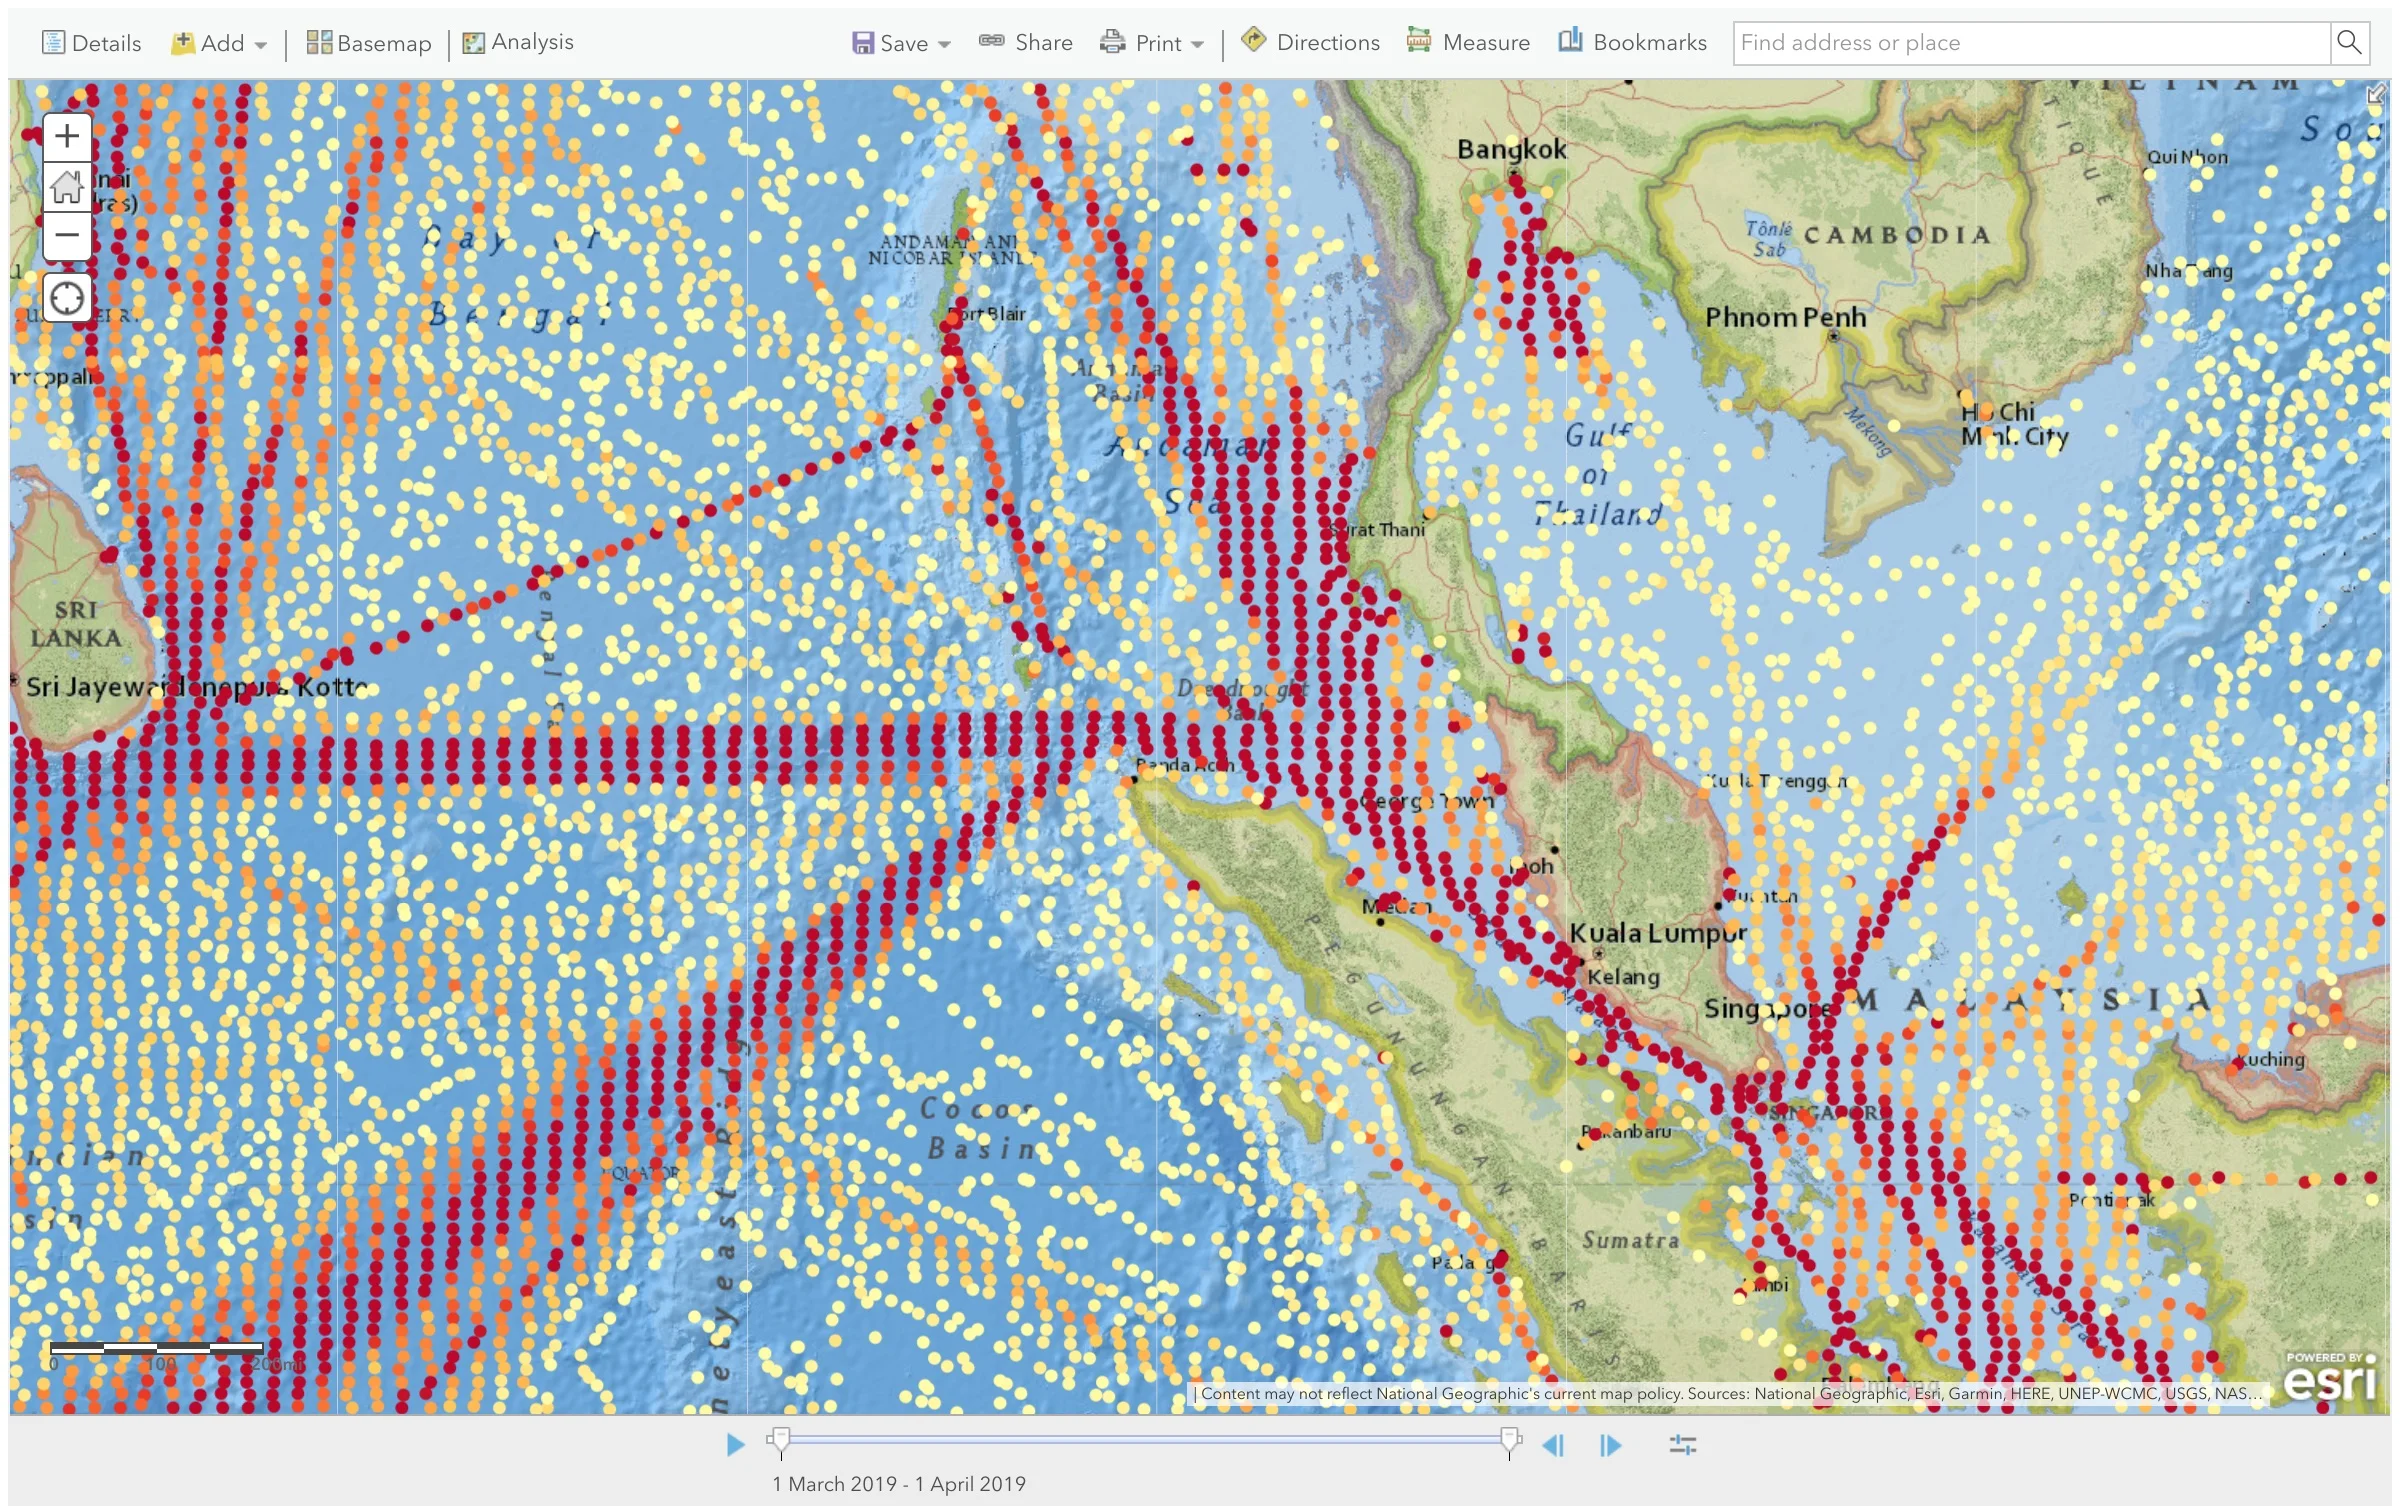
This is a feature service displays around 1.5 billion AIS point in aggregate for the first quarter of 2019. The points represent, simply, the total count of the number of vessel movements recorded in the area, based on the geohash.org public domain geocoding system. For more information on the how the data is specifically aggregated, stored and pushed to this format please contact info@40geo.com. This is spire AIS (spire.com) historical data within esri’s ArcGIS Online
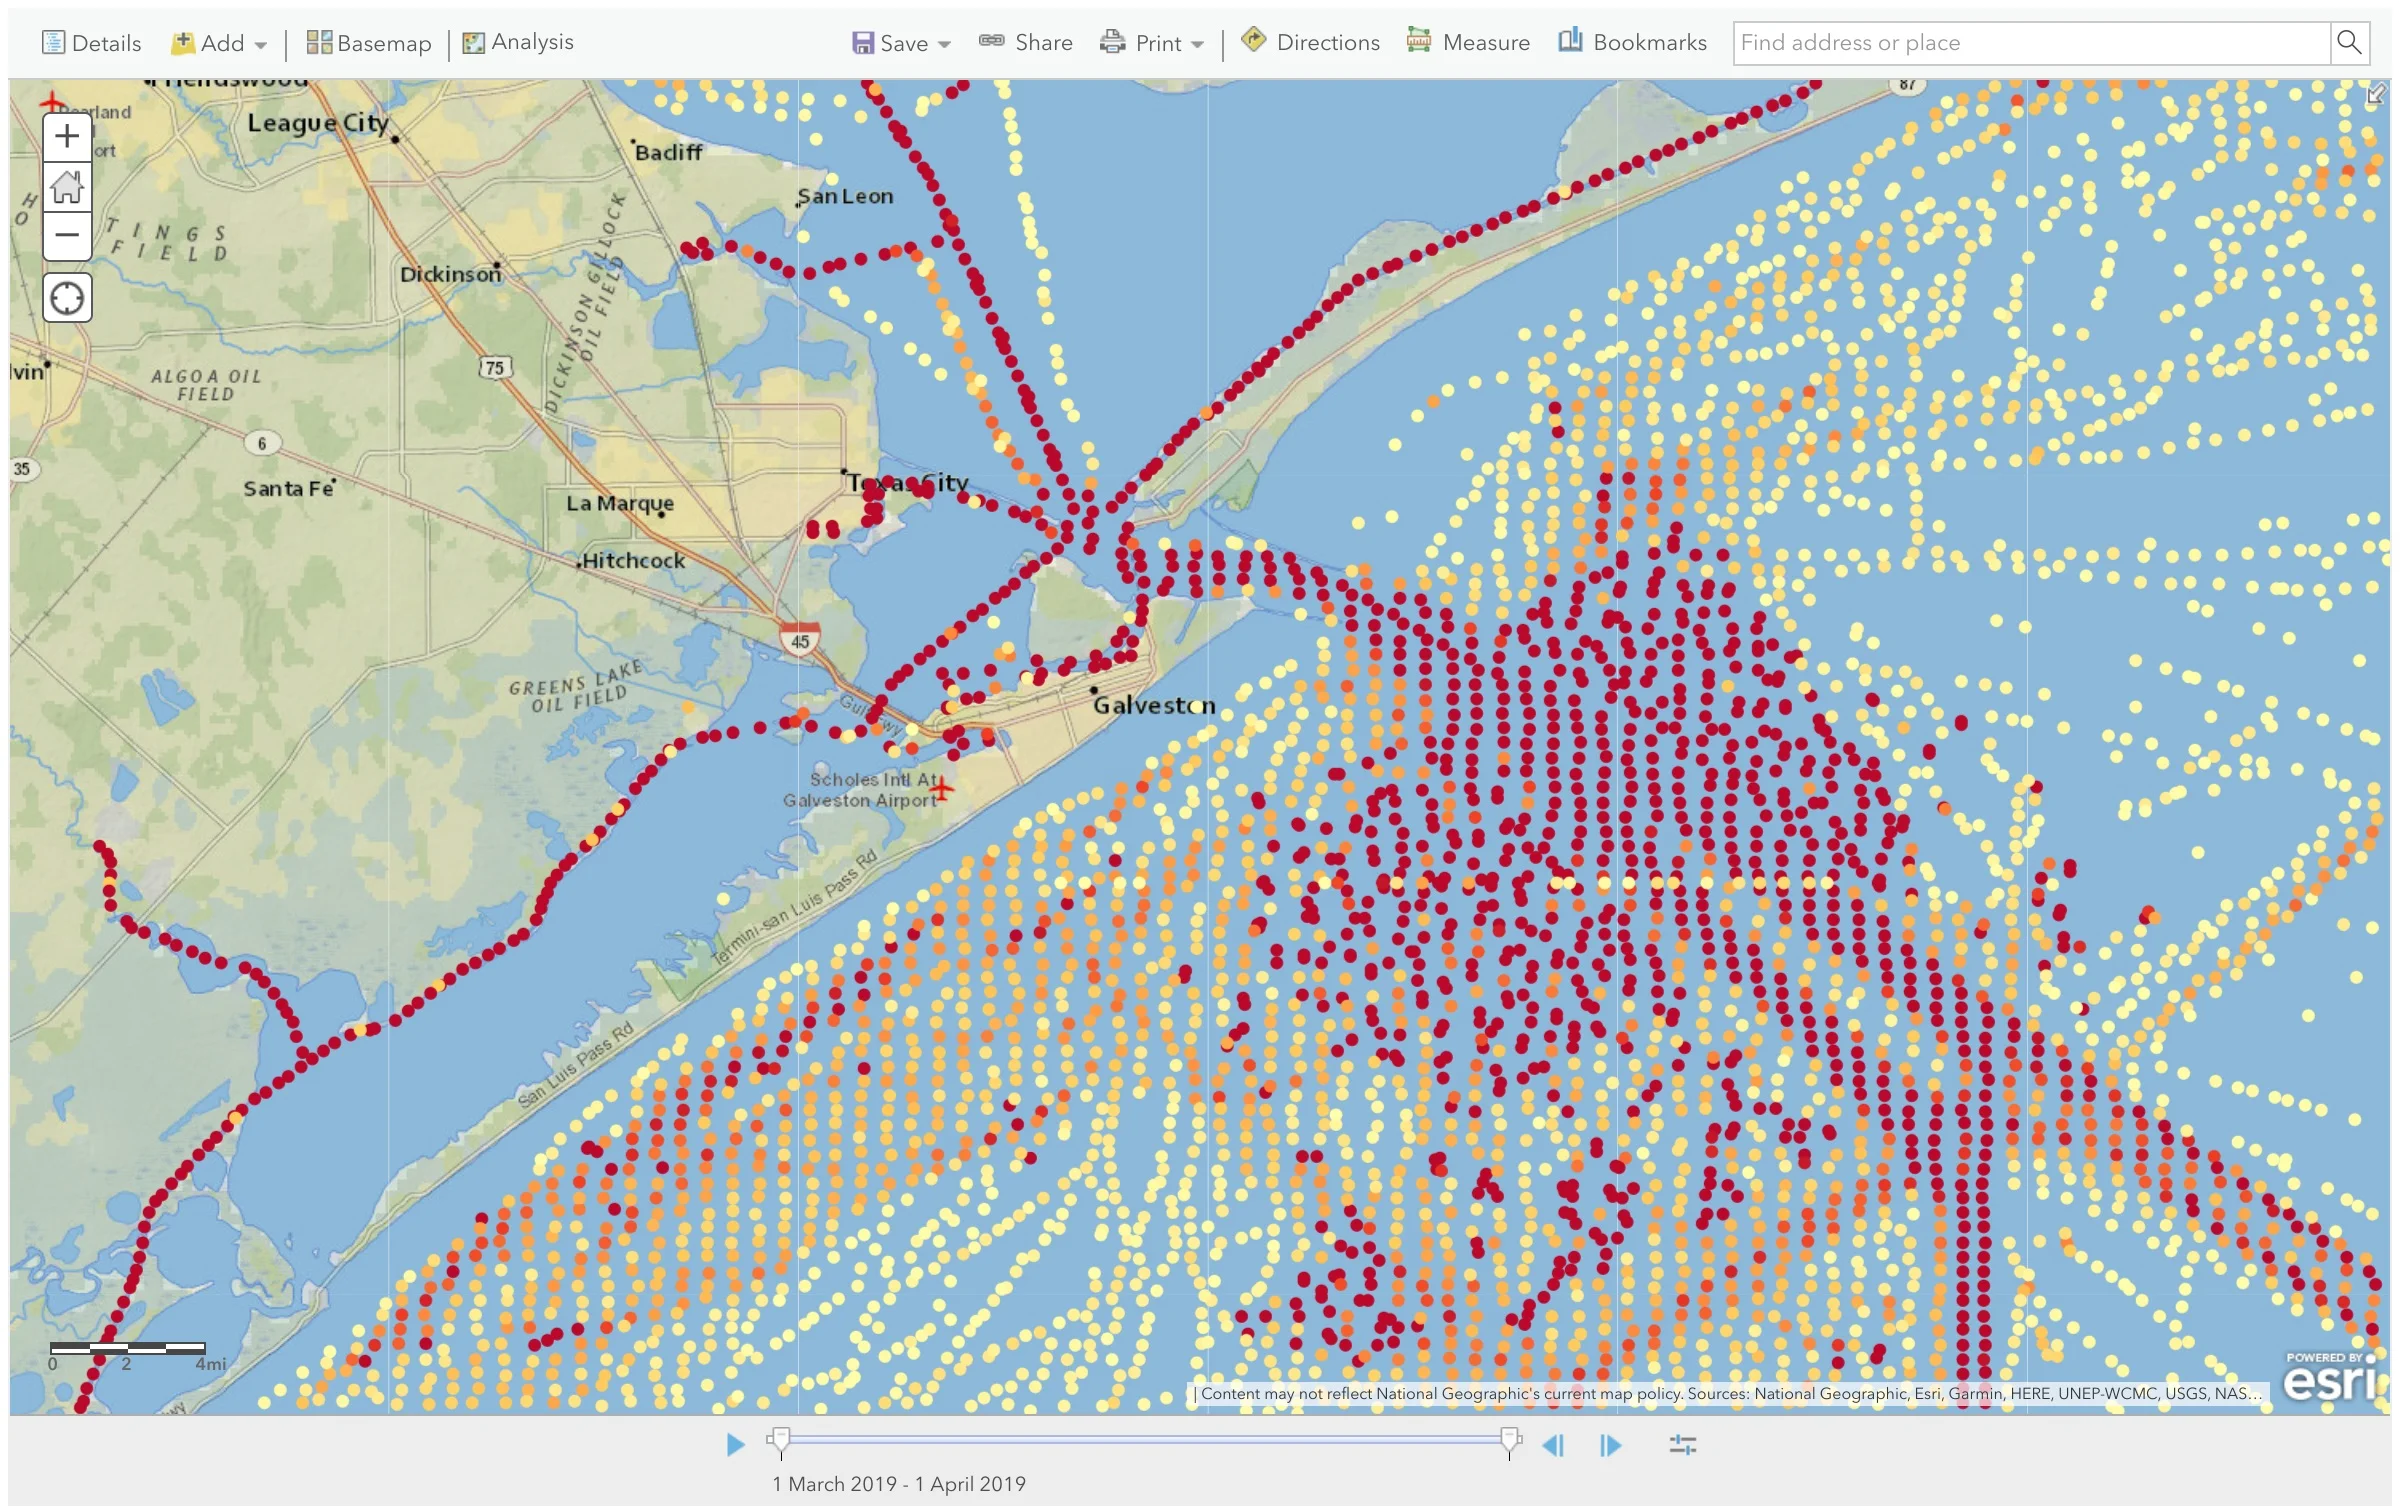
This is a feature service displays around 1.5 billion AIS point in aggregate for the first quarter of 2019. The points represent, simply, the total count of the number of vessel movements recorded in the area, based on the geohash.org public domain geocoding system. For more information on the how the data is specifically aggregated, stored and pushed to this format please contact info@40geo.com. This is spire AIS (spire.com) historical data within esri’s ArcGIS Online
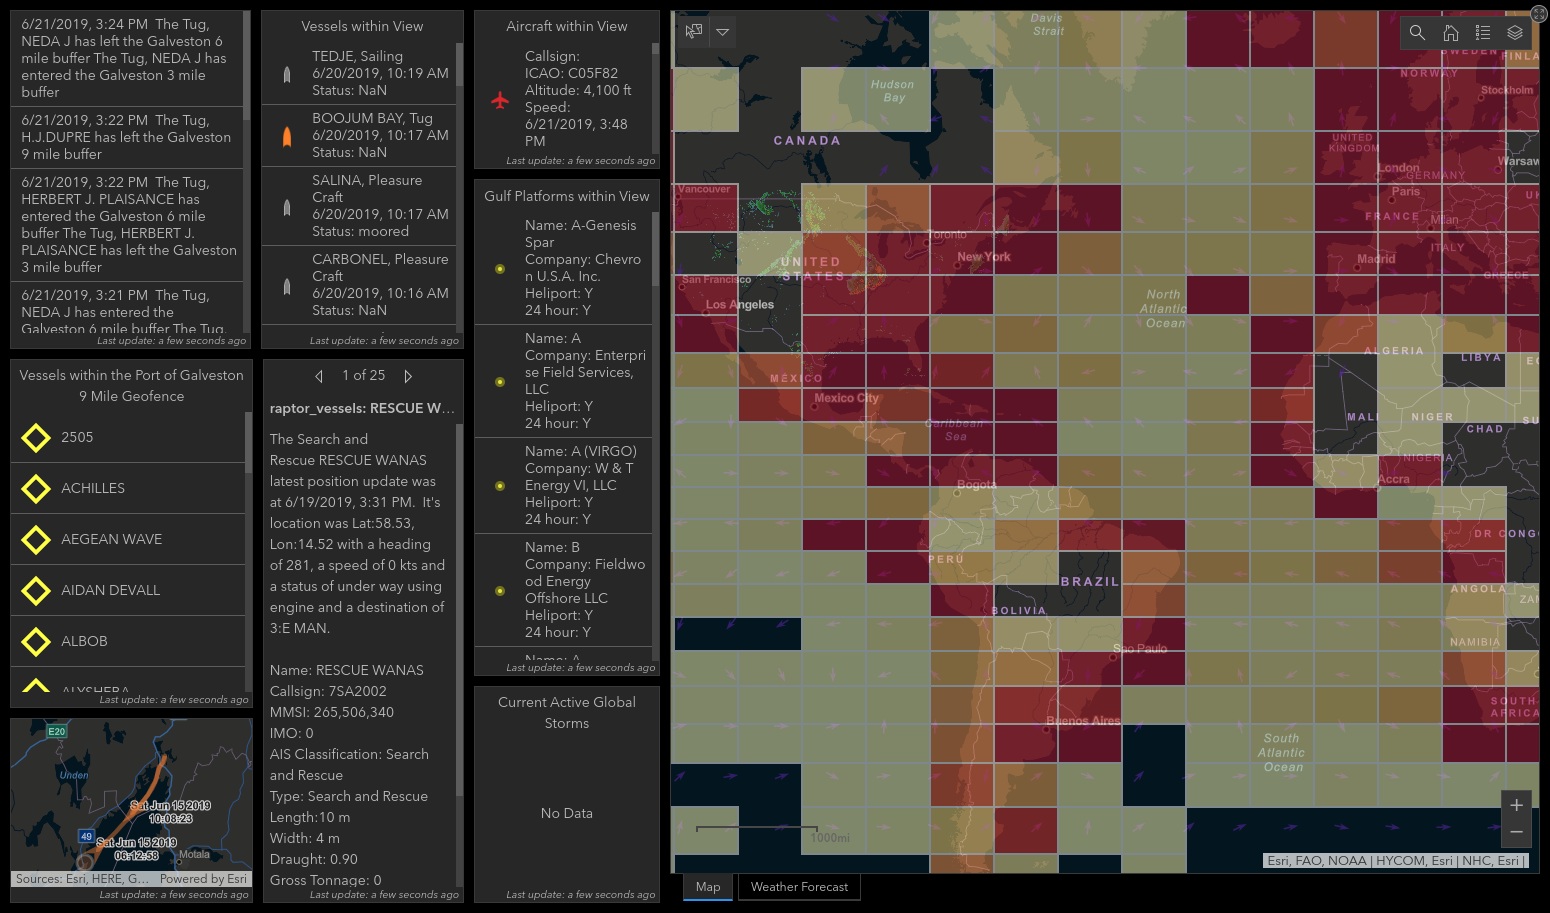
This is a real-time aggregated vessel density map representing a heat map of current vessel locations at a global scale with Esri’s Operations Dashboard. The AIS data is provided by Spire (Spire.com) This Raptor Geo-IoT Feature Service can be added to any of your Esri Web Maps and symbolized the way you want to display the info. It can also be filtered by the attributes is holds, example, a heat map of all Oil Tankers.

Raptor Geo-IoT services inside of esri’s Operations Dashboard in ArcGIS Online. This shows the freshness (how old the data is) of the AIS data that is being provided, the AIS vessel information is provided by Spire (spire.com)
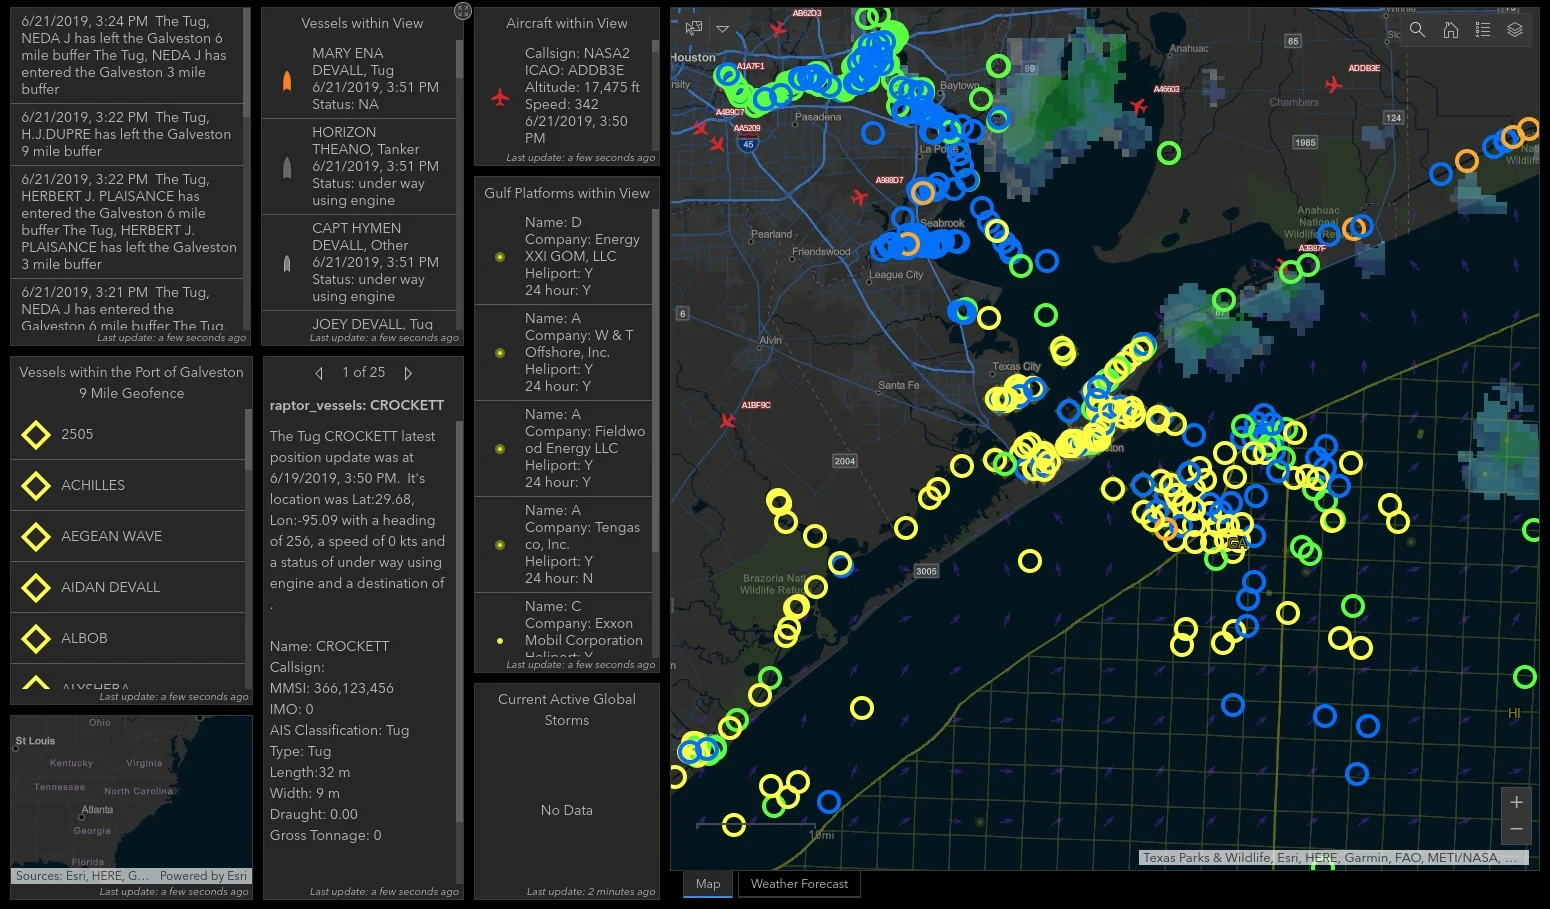
Raptor Geo-IoT services inside of esri’s Operations Dashboard in ArcGIS Online. This shows the different sources of the AIS data flowing in (Blue=AISHUB, Yellow= Raptor Radio (40Geo provided AIS Hardware), Green=Spire Satellite, Orange=Spire Terrestrial) ) This screenshot demonstrates the ability of Raptor Geo-IoT to merge 10000+ events a second from dozens of sources into one best of breed IoT layer.
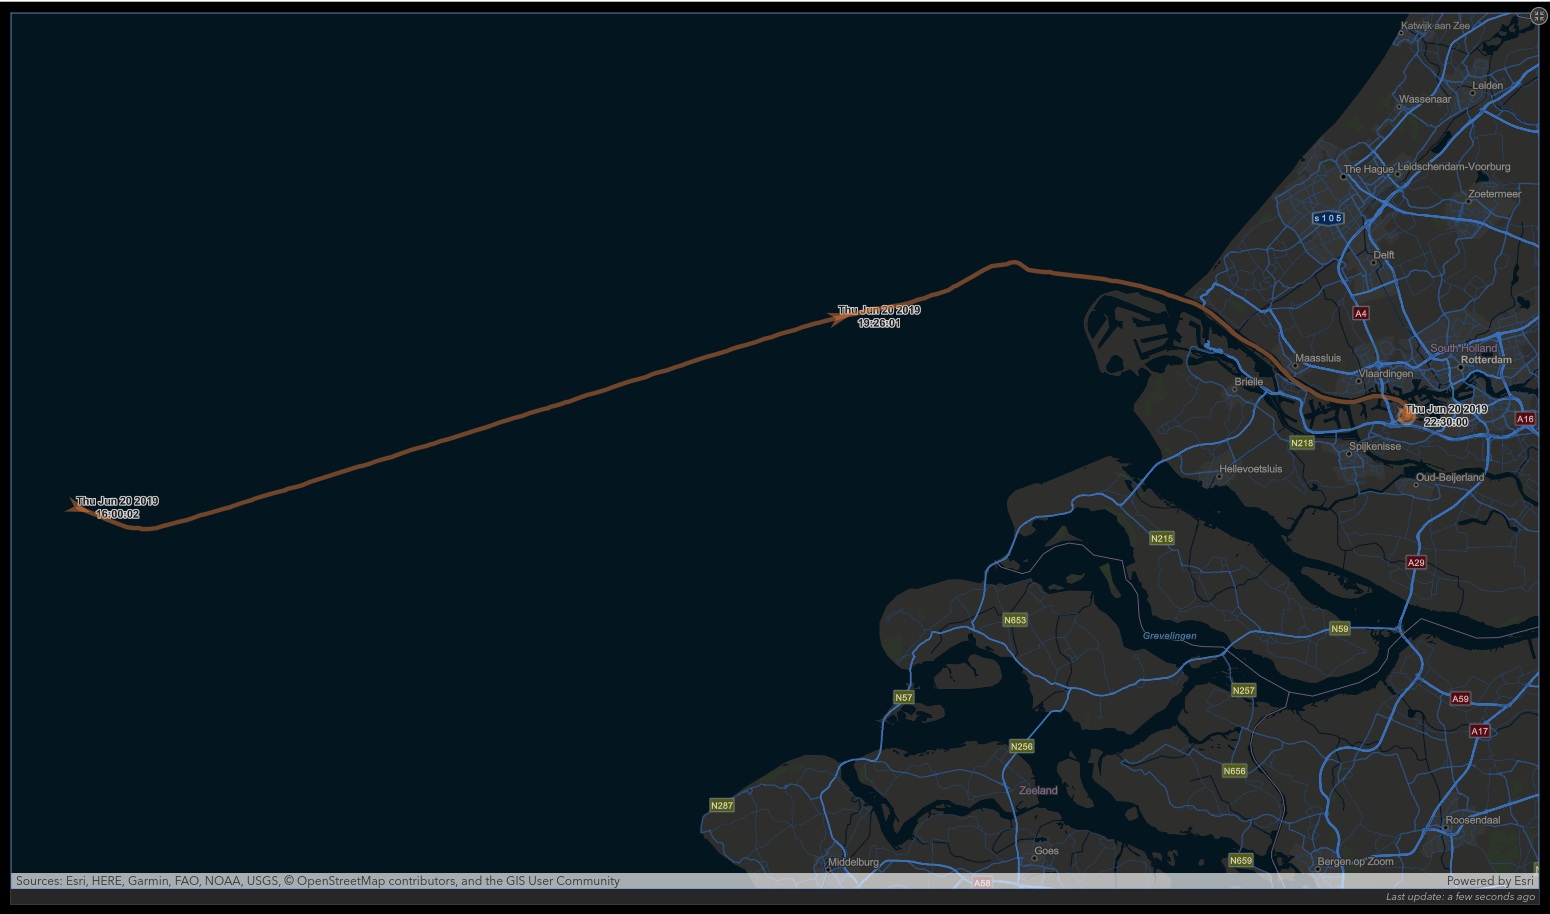
This shows the ability of the Raptor Geo-IoT platform to deliver historical tracks of the location report points the IoT sensors are providing. This is esri’s Operations Dashboard.

The geospatial IoT does not always require a map for the end user. This is an example of the weather forecast API from spire.com to provide 10 day forecasts for each vessel, anywhere in the world. This is esri’s Operations Dashboard.
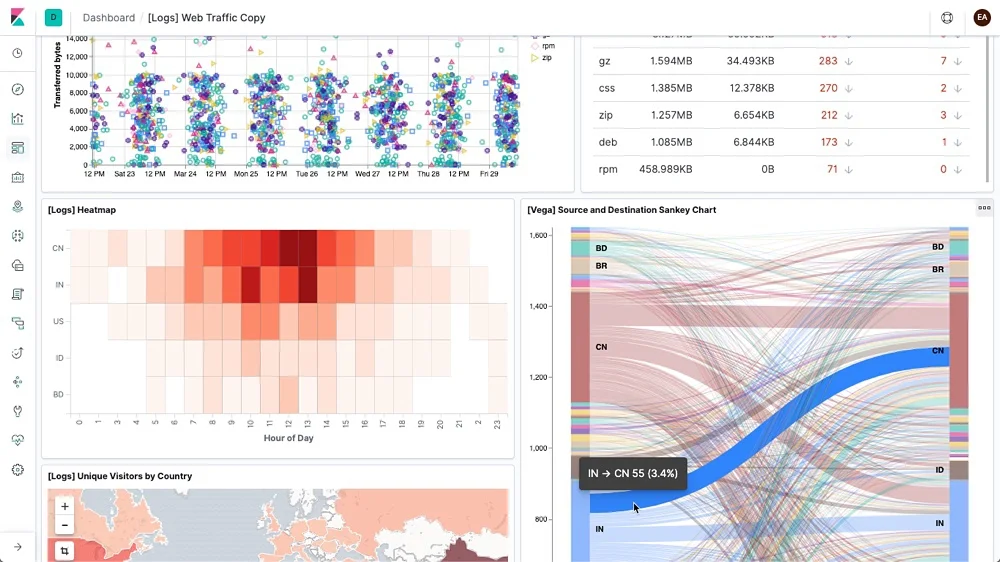
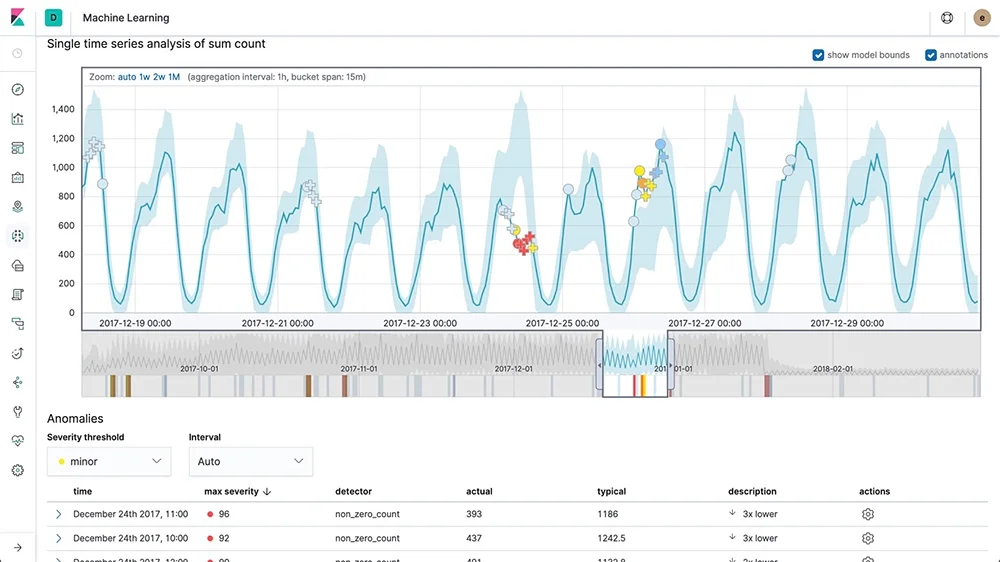
Raptor Geo-IoT leverages the power of Elasticsearch and Kibana for IoT analytics, machine learning, custom automated reporting engine and feed monitoring